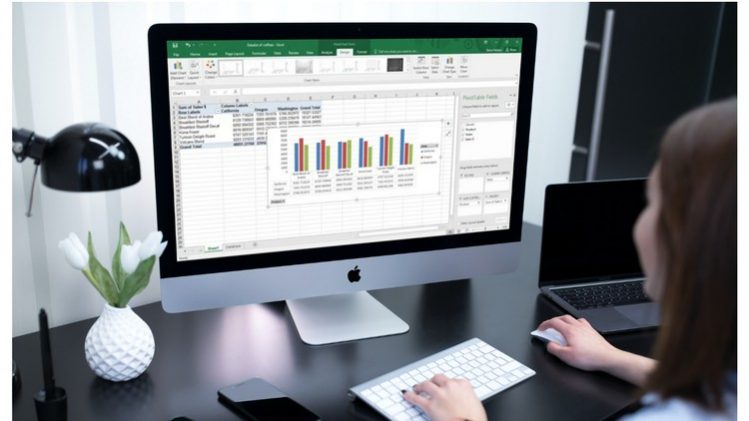
Learn Excels most powerful data analysis tool
Learn How to analyze, Sort, Filter and Analyze data in a understandable way.
Learn some of the Best Practices for Sourcing, Sorting, Formatting and creating Custom Styles.
Get a solid understanding of everything about Pivot Tables from Bestselling Udemy Instructor.
Pivot tables are one of Excel’s most powerful features. A pivot table allows you to extract the significance from a large, detailed data set. A Pivot Table is a summary of a large dataset that usually includes the total figures, average, minimum, maximum, etc. let’s say you have a sales data for different regions, with a pivot table, you can summarize the data by region and find the average sales per region, the maximum and minimum sale per region, etc. Pivot tables allow us to analyse, summarize and show only relevant data in our reports.
This online course is designed to give you a solid understanding of Pivot Tables, taking you from novice to ninja!.
In this course you will explore the Ultimate power of Pivot Tables in Sorting, Filtering, Analyzing and Presenting complex data in a easy to Understand Format and derive meaning outputs for decision making.
The course will Equip you with the Best Practices for preparing source data, using database , preserve formats and create custom styles, sorting and filtering techniques, and much more.
Every lecture comes with ample to resource files and case studies for your practice and hands on experience.
Whether you are new to the world of Excel or a regular User, this course will be a milestone on your journey to become a Excel Ninja and a Go To Person at Work.
I am totally Excited to see you inside the course.


