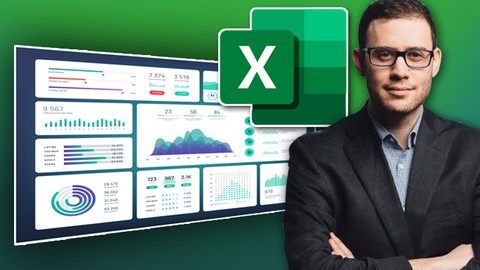
Microsoft Excel Dashboards & Data Visualization Mastery
The only Microsoft Excel Dashboard, Data Visualization & Data Analysis course for INTERMEDIATE to ADVANCED EXCEL users!
What you’ll learn
-
Students will learn ADVANCED skills to create Dashboards and data visualizations in Excel
-
Students will become EXPERTS at creating INTERACTIVE ANALYSIS
-
Students will be able to QUICKLY CREATE Dashboards, Reports, and Interactive Applications (WITHOUT macros)
-
Become more PRODUCTIVE at using Microsoft Excel which will SAVE YOU HOURS per day & ELIMINATE STRESS at work!
-
We teach you how to use Microsoft Excel with CONFIDENCE that will lead to greater opportunities like a HIGHER SALARY and PROMOTIONS!
-
Increase your Microsoft Excel SKILLS and KNOWLEDGE within HOURS which will GET YOU NOTICED by Top Management & prospective Employers!
-
DOWNLOADABLE Excel workbooks so you can keep on your desktop & practice!
-
Test your skills with various real life Quizzes & Homework Practice Activities & Assignments!
-
Personal Excel support from Professional Excel Trainers with 30+ Years of combined Excel Training!
Requirements
-
This course is for INTERMEDIATE or ADVANCED Excel users. If you are brand new to Excel with no prior knowledge, this course is NOT for you.
-
Excel for Windows 2010, 2013, 2016, 2019, Office 365 and Excel for Mac 2011 and 2016
Who this course is for:
- INTERMEDIATE Excel users looking to take their skills to the next level
- Data workers with titles like ANALYST, MANAGER, PROGRAM MANAGER, FINANCIAL MANAGER, BUSINESS ANALYTICS DEVELOPER, and DATA SCIENTIST
- Managers, financial analysts, business analysts looking to really wow their colleagues with Excel
- People who want to change career and apply for a new job
- If you want to leverage Excel to stand out from the crowd, save hours each day, eliminate stress & get a promotion or pay-rise, then you are invited to join this course!


